Tax Practitioners Board
- PROJECT: Registration and renewals digitital transformation
- DELIVERABLE: Dashboard widget
- PURPOSE: To help staff access, interpret and report key operational statistics more efficiently
- DESIGN APPROACH: Stakeholder consultation, prototyping and usability testing
- TOOLS: Axure, Procreate
Background
The Tax Practitioners Board (TPB) is a national statutory body responsible for the registration and regulation of tax agents, BAS agents, and tax (financial) advisers in Australia.
While the TPB is independent of the Australian Taxation Office (ATO), the two agencies work together to maintain the integrity of the tax system.
Problem
Staff using an internal dashboard needed a method to view at a glance meaningful statistics, and download reports reflecting the statistics.
I was asked to design a dashboard widget that would be able to present a range of options to select from, display statistics for comparison numerically and statistically, and to provide a download option of the data selected.


Solution
SME discovery and requirements definition
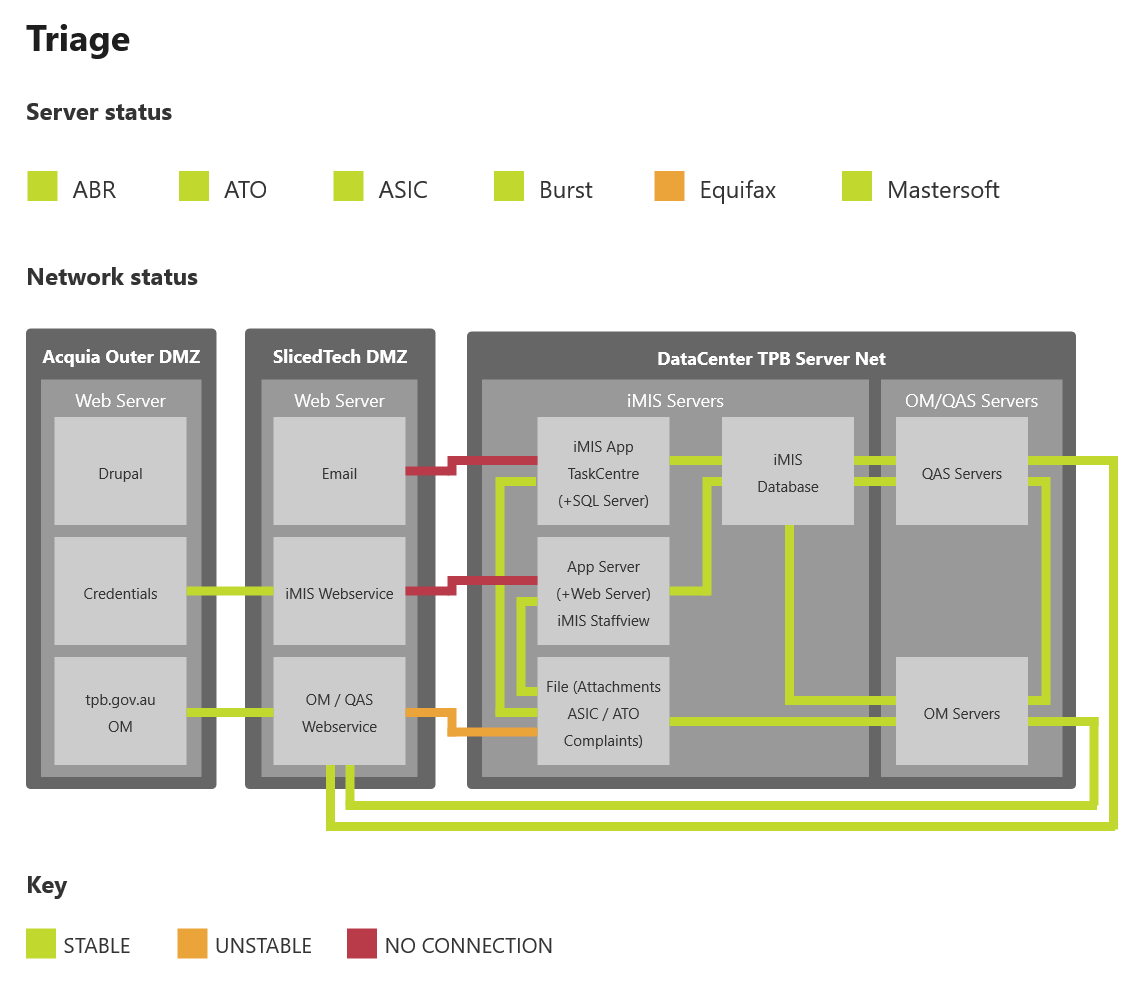
I met with the subject matter expert to understand which statistics could be retrieved from the system through the API. I documented the available data, required outputs and key constraints, then translated these discussions into a clear set of requirements for the widget.
Concept exploration and initial mockups
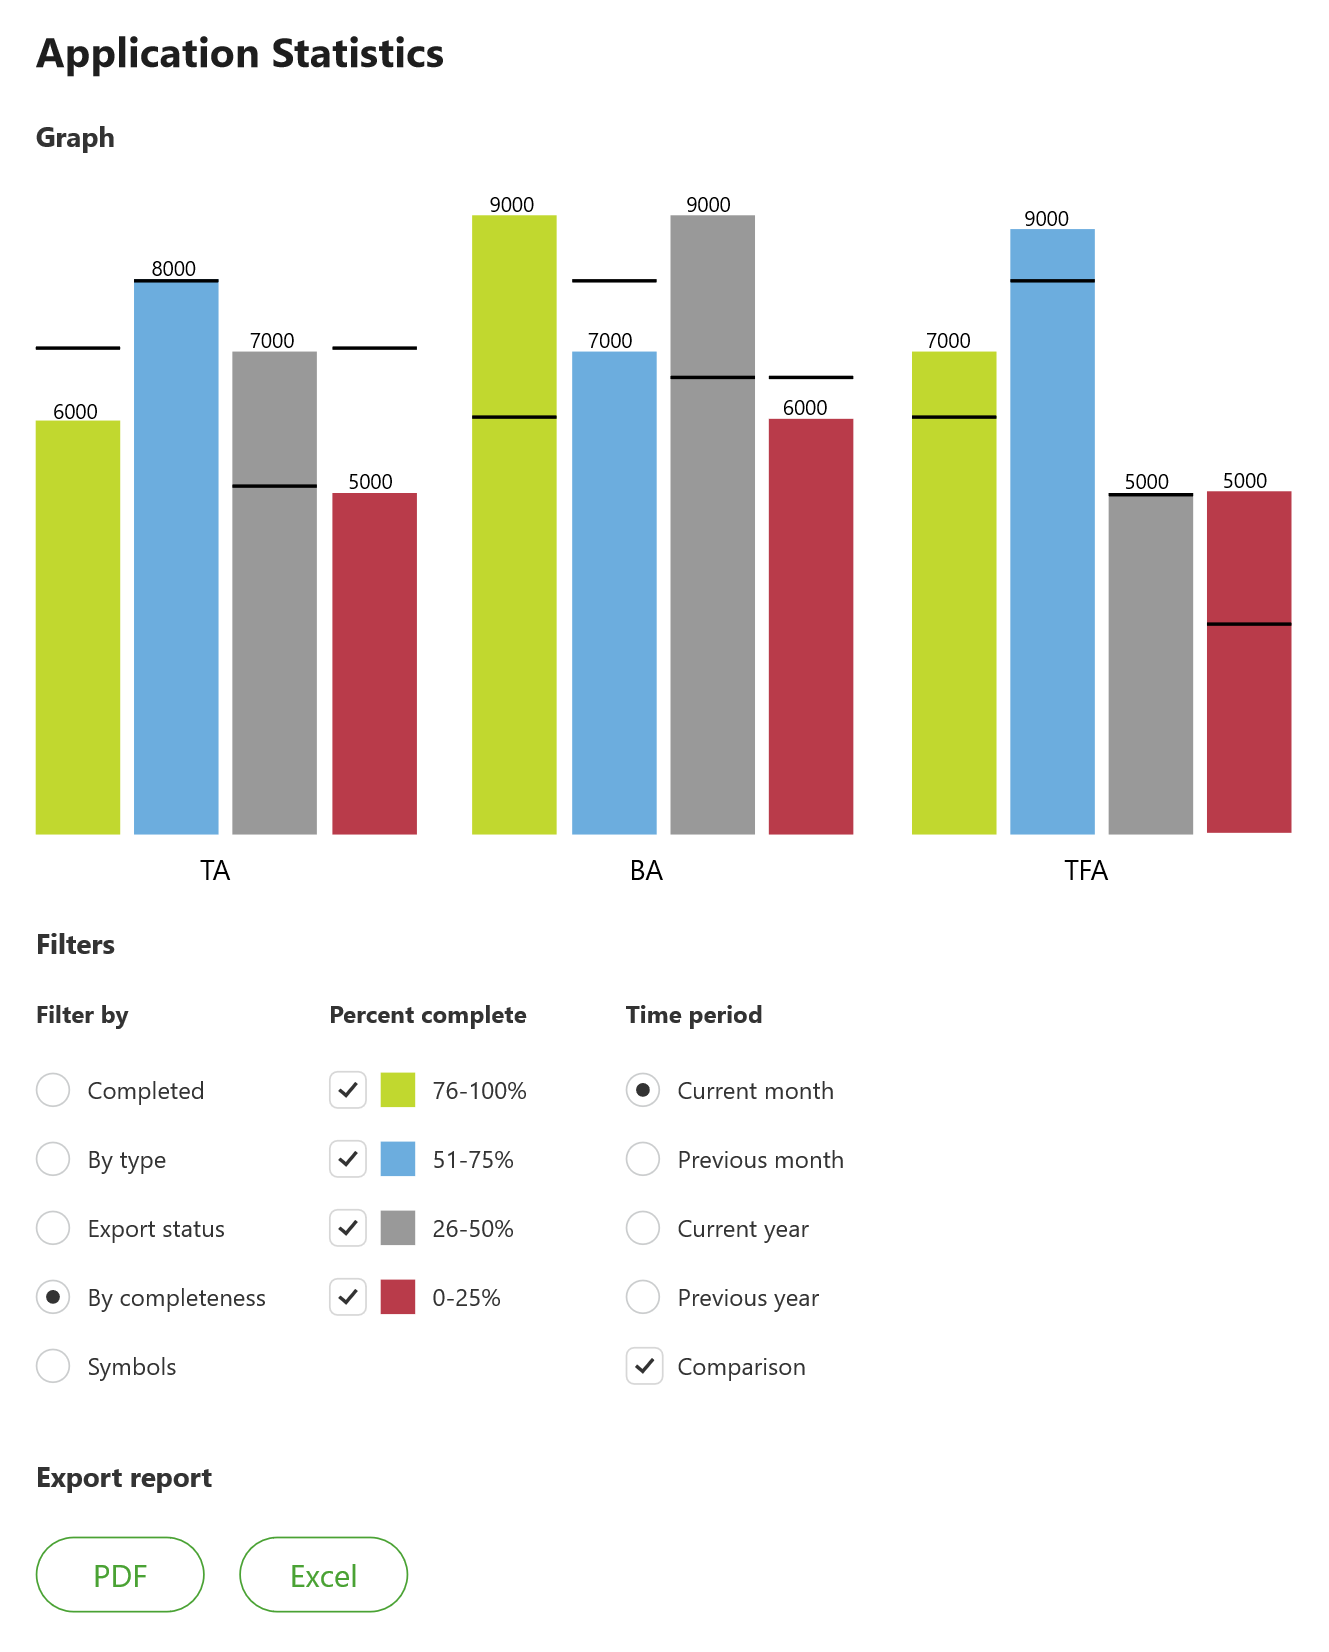
Using the requirements as a starting point, I sketched different ways the information could be structured and displayed. I then converted the requirements into individual mockups, allowing each data type and interaction need to be reviewed separately before they were combined into a single interface.
SME and Product Owner review
I presented the early concepts to the subject matter expert and Product Owner to confirm that I had interpreted the requirements correctly. Their feedback helped clarify the data users needed to access, how it should be grouped and which controls were required to support meaningful analysis.
Data interface and interaction design
I refined the interface to support filtering by multiple criteria, selecting multiple options within a chosen category and defining a relevant time period. I also designed how the selected data would be displayed and how users could prepare the results for export.
Consolidated widget design
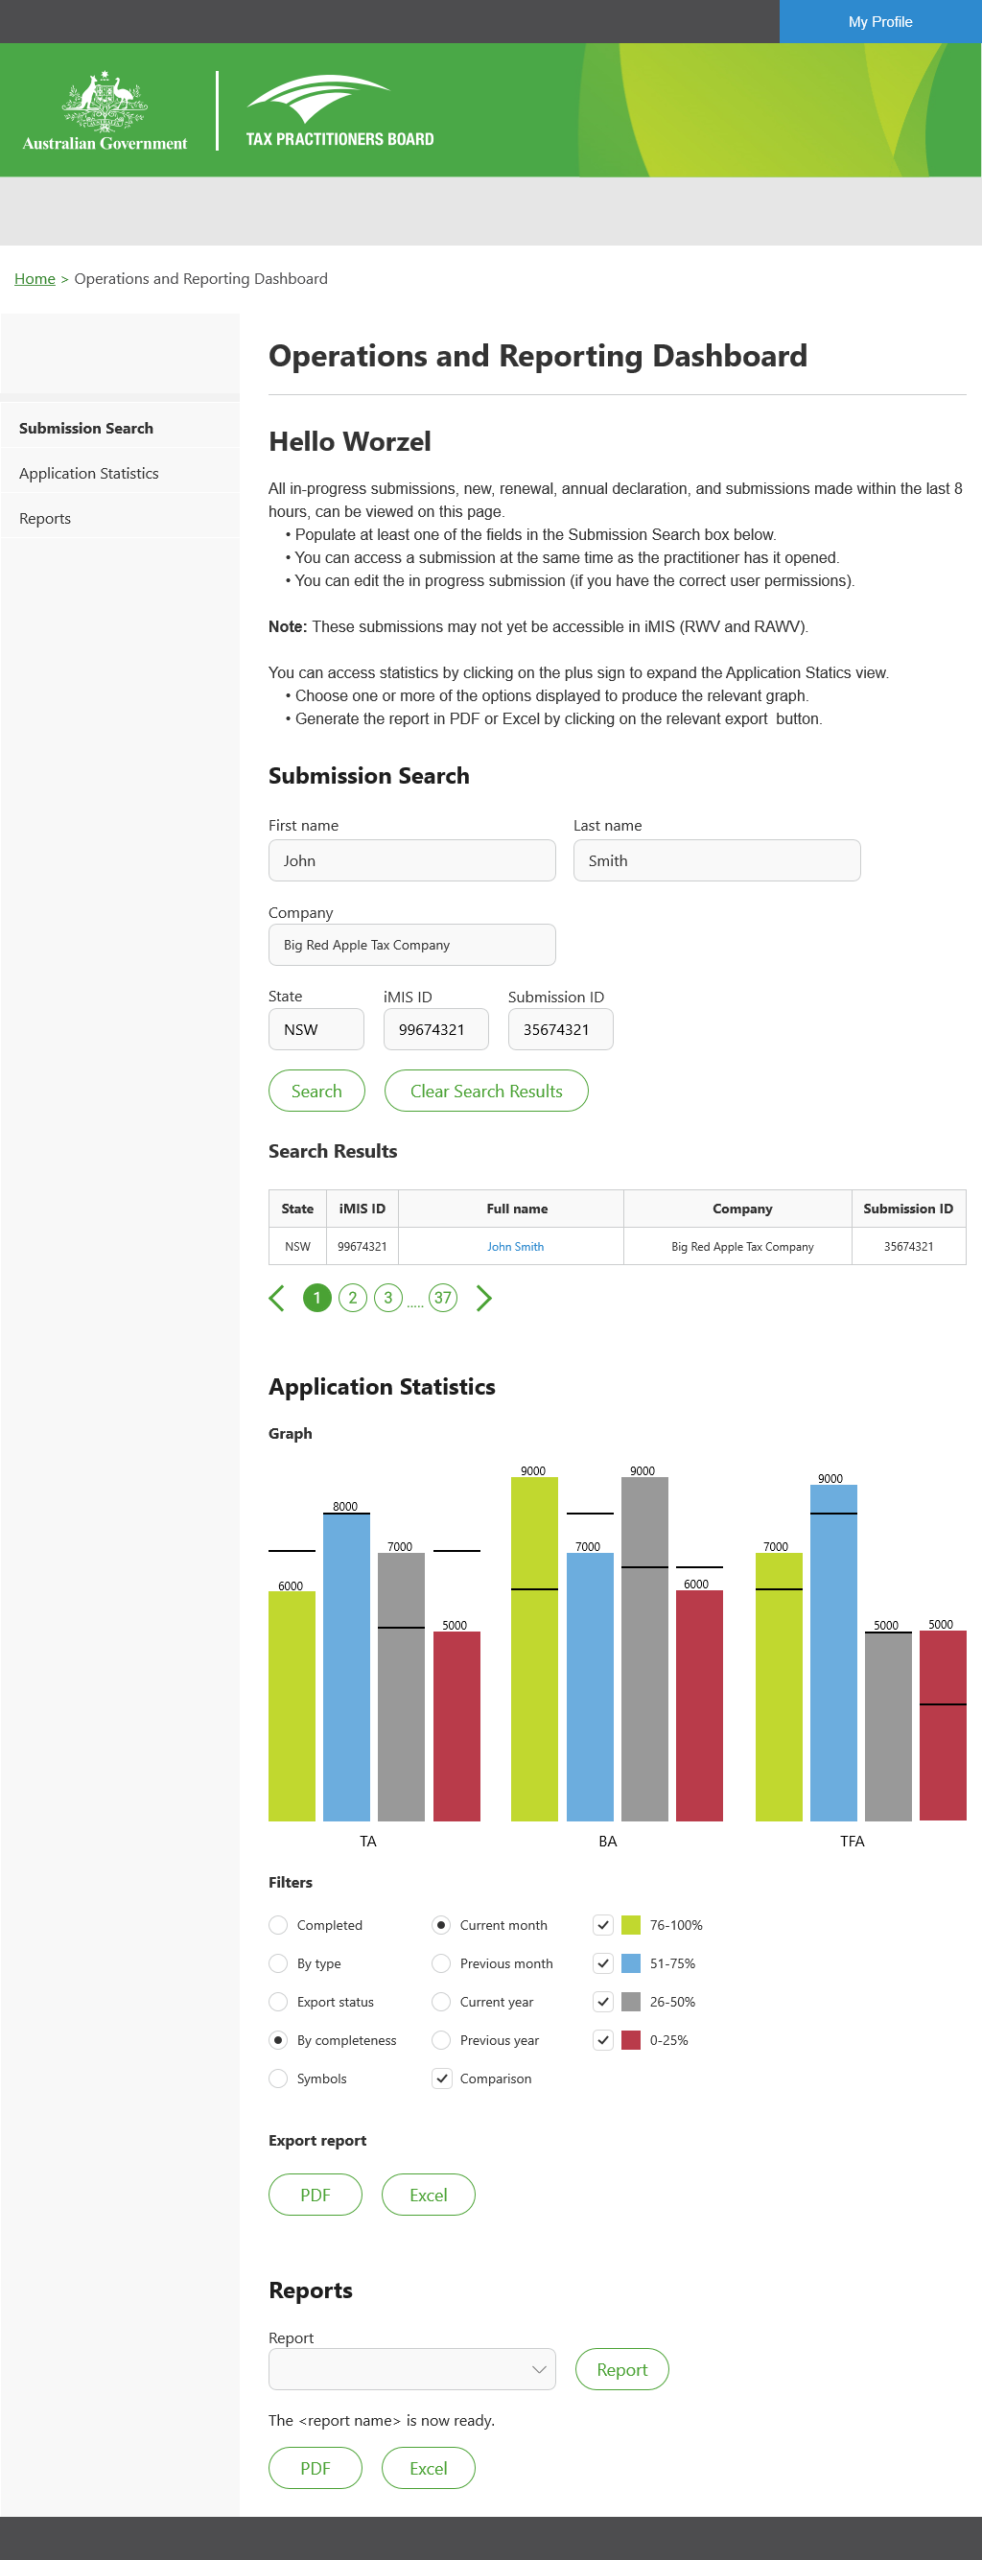
The final design brought the separate data views and interaction requirements into one consolidated widget. Users could filter and refine the available statistics, select a time period and export the resulting information in PDF or Excel format.
Reflections
In future, I would validate the consolidated widget with representative end users rather than relying primarily on feedback from the subject matter expert and Product Owner. I would also involve the development team earlier to confirm API behaviour, data limitations, and export requirements before finalising the interaction model, reducing the risk of design changes during implementation.